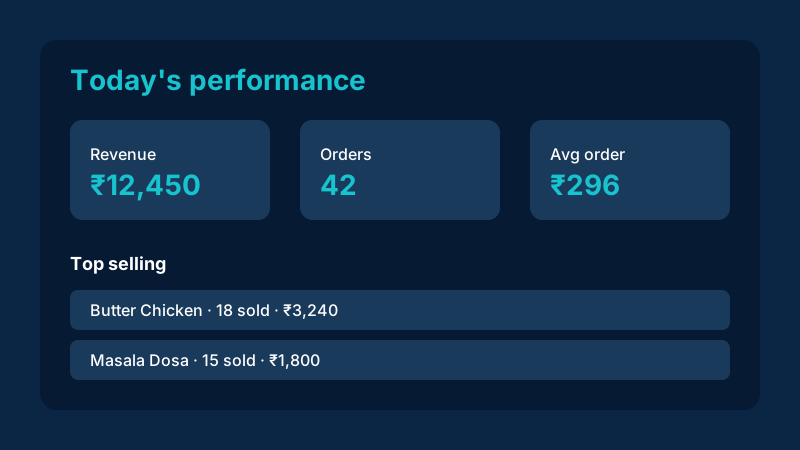
During a busy lunch service the owner rarely has time to open the order list, the inventory screen and the sales report one after another. The NHY owner dashboard puts today's revenue, order count, average order value, top-selling items, recent orders and low-stock alerts on a single scrollable screen that refreshes when you pull down. It is available from the Basic plan upward and loads the core numbers first so the rest of the panels fill in as they arrive.
The practical problem
Scattered numbers create delays. You notice a low-stock item only after a guest has already ordered it. You discover the average order value dropped only at the end of the day. Staff ask for the latest total while you are still unlocking the phone. A single landing screen that surfaces the live totals and the most urgent warnings removes those extra steps.
Realistic example
A café owner on the Basic plan opens the NHY app at 11:15 a.m. The dashboard shows ₹8,200 in revenue from 28 orders and an average of ₹293. The top-selling list highlights the breakfast sandwich and filter coffee. A yellow warning appears because the bakery bread is at 80 percent of its monthly product limit and one ingredient is below the reorder threshold. She taps the low-stock card, opens Inventory, and marks the sandwich sold out before the next table orders. Five minutes later she is back on the floor with the numbers already in mind.
Step-by-step workflow
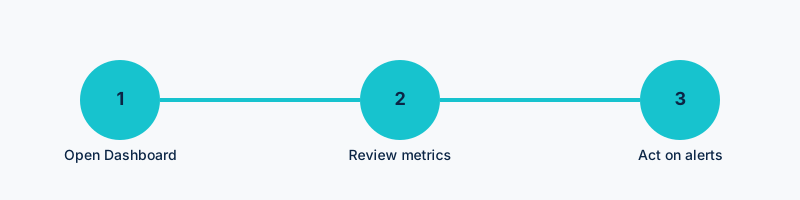
- Open the Dashboard from the owner home (Basic plan and higher). Free plan users see basic menu and QR features but the full analytics panels require the upgrade. The screen greets you by name and shows the store name and current date.
- Read the core metrics. Four cards display today's revenue, today's order count, average order value and total menu items. These load first; the rest of the screen fills in afterward.
- Check alerts. Low-stock items appear as a tappable card that jumps to Inventory. Plan-limit warnings (orders, products, team members, tables) appear when you cross 80 percent of the allowance and link to subscription management. Location-limit warnings are suppressed because every plan ships with one location.
- Scan top sellers and recent orders. The top-selling list shows product name, quantity sold and revenue. Recent orders display order number, type, time, total and status. Tap "View All" to open the full order history.
- Use quick actions. Buttons for QR codes, add menu item, manage team, tables and bookings, billing and store settings sit at the bottom so you can jump without returning to the menu.
- Refresh. Pull down to reload all numbers. The dashboard stays interactive while secondary data arrives.
Free: Core menu and QR ordering available; full analytics dashboard gated behind Basic.
Basic: Included — analytics_basic enabled; dashboard shows live metrics and alerts.
Professional: Included — analytics_basic plus advanced_analytics.
Enterprise: Included.
Enterprise Plus: Included.
No separate monthly quota for dashboard views. Underlying limits (orders per month, products, tables, team members) still apply and surface as warnings on the same screen.
Evidence-based benefits
- One screen replaces separate trips to sales, inventory and order history for the most common morning checks.
- Low-stock and plan-limit warnings appear before they become customer-facing problems.
- Top-selling items update from live order data so you can adjust specials or staffing mid-shift.
- Quick-action buttons reduce navigation time between the dashboard and the tools you use next.
Prerequisites and limitations
- Basic plan or higher for the full analytics panels and low-stock integration.
- Numbers reflect completed and ready orders for the current calendar day in the store's timezone.
- Top-selling list is limited to the highest items returned by the analytics service (typically the top five).
- Plan-limit warnings use the same TIER_LIMITS enforced elsewhere; they do not create new quotas.
- The dashboard is read-only; changes to stock, orders or team members happen on the destination screens.
FAQs
Does the Free plan show any numbers? Free plan users can open the app and manage a basic menu and QR tables. The full dashboard metrics and low-stock cards require Basic or higher.
How fresh are the numbers? Core metrics load on open and on pull-to-refresh. Secondary panels (recent orders, low stock, usage) arrive independently so a slow inventory call does not block the revenue cards.
Can I export the dashboard? The dashboard itself does not include an export button. Order history and tax tools on higher plans provide export paths for accountant review.
Ready to see today's numbers in one place?
Open the NHY app